
Page 157 - Textos de Matemática Vol. 47
P. 157
Model II
III IV
True values a = 0.6 b = 0.4 2 = 2.0 a = 0.6 b = 0.4 2 = 3.0 a = 0.6 b = 0.7 2 = 1.0
Min Q0.25 Q0.50 Mean 0.3615 0.5325 0.6001 0.5976
0.1605 0.3362 0.4215 0.4190 0.8264 1.7320 2.1110 2.2110 0.2063 0.4818 0.5573 0.5515 0.1750 0.3277 0.3839 0.3830 1.5976 2.7146 3.2480 3.4051 0.1893 0.4358 0.4899 0.4918 0.2693 0.5505 0.6487 0.6395 0.6535 1.0610 1.2350 1.2980
Q0.75 0.6623
0.4988 2.6380 0.6293 0.4434 3.9411 0.5527 0.7346 1.4940
Max
0.8271 0.6941 4.2670 0.7909 0.5530 7.1505 0.7923 0.8999 2.5900
1000.
PARAMETER ESTIMATION OF BILINEAR PROCESSES USING ABC 147
Density Observations
0 1 2 3 4 0 20 40 60
Density Observations
0.0 0.5 1.0 1.5 2.0 2.5 3.0 −50 0 50 100
Density Observations
0.0 0.1 0.2 0.3 0.4 0.5 0.6
−40 −20 0 20 40
0 1000 2000 3000 4000 5000 Index
0 1000 2000
3000 4000 5000
0 1000 2000 3000 Index
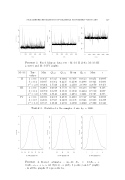
Figure 3. Fixed bilinear data sets - Model II (left), Model III (centre) and Model IV (right).
Table 3. Statistics for the samples of size kN =
0.3 0.4 0.5 0.6 0.7 0.8 0.9 0.2 0.4 0.6 0.8 1
N = 1000 Bandwidth = 0.03 N = 1000 Bandwidth = 0.04
2 3
4
Figure 4. Kernel estimates - model Xt = 0.6Xt 1 + 0.4Xt 1✏t 1 + ✏t, ✏t iid N(0, 2) - a (left), b (centre) and 2 (right) - in all the graphs N represents kN .
Index
4000 5000
s
0.0887 0.1083 0.6453 0.105 0.077 0.885 0.0899 0.1277 0.3143
N = 1000 Bandwidth = 0.15
