
Page 44 - Textos de Matemática Vol. 47
P. 44
34 E. GONC¸ALVES AND C. M. MARTINS
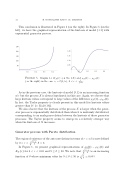
This conclusion is illustrated in Figure 5 (on the right). In Figure 5 (on the left), we have the graphical representation of the kurtosis of model (3.1) with exponential generator process.
250
200 0.20
150 100 50
0.15 0.10 0.05
0.1 0.2
0.3 0.4
0.1 0.2
0.3 0.4
Figure 5. Graphs for KX (r) (on the left) and ⇢X (1) ⇢X2 (1) 1
(ontheright)inthecase"t ⇠E(1/↵),0<r< p424.
As in the previous case, the kurtosis of model (3.1) is an increasing function of r but the process X is always leptokurtic in this case. Again, we observe that large kurtosis values correspond to large values of the di↵erence ⇢X (1) ⇢X2 (1). In fact, the Taylor property is clearly present in this model for kurtosis values greater than 16 (' KX (0.16)).
We also observe that the kurtosis of the process X is larger when the gener- ator process is exponentially distributed than when it is uniformly distributed, corresponding to an analogous relation between the kurtosis of those generator processes. The Taylor property seems to emerge in a relatively stronger way when the kurtosis of X increases.
Generator process with Pareto distribution
The region oqf existence of the autocorrelations in terms of r = ↵ is now defined by0<r<4 ✓ 4,✓>8.
✓
In Figure 6, we present graphical representations oqf ⇢X (1) ⇢X 2 (1) and
q4 ✓ 4
KX (r) for 0 < r < 0.85 and 9 ✓ 50. We note that ✓ is an increasing
functionof✓whoseminimumvaluefor9✓50is 4 5 '0.863. 4
