
Page 54 - Textos de Matemática Vol. 47
P. 54
44 J. LEITE
well over half the boundary when 1 = 0. Hence, the Taylor property is present in models that can also reproduce the leverage e↵ects.
The extension to models with 1 not so close to zero is due to the continuity of ⇢n (1) and ⇢n (2), when viewed as functions of ↵1, 1 and 1, and arises when the results presented here are considered with the one that establishes the presence of the Taylor property in the AVGARCH(1,1) model, which was obtained by Haas [12, corollary 3].
To further explore the parameterizations region satisfying the Taylor prop- erty, we now consider that the generating process variables has a centered and reduced distribution based on Student’s t-distribution with n degrees of free- dom, i.e., with density
1 n+1 ✓ x2 ◆ (n+1)/2
fZ (x) = p 2 1 + , x 2 R.
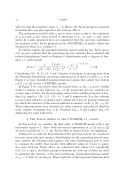
Considering 120, 30, 15, 14, 7 and 5 degrees of freedom, so moving away from the Gaussian distribution, and using expressions (2.3) and (2.5) with 1 = 0, in Figure 1 we have identified parameterizations regions that satisfy the relation ⇢1 (1) > ⇢1 (2) for the 1-TARCH(1) model.
In Figure 1 we can observe that the region where ⇢1 (1) > ⇢1 (2) is verified seems to enlarge as the kurtosis, kZt , of the generating process variables in- creases, since we have, for the decreasing values of the considered degrees of free- dom, kZt equal to 3.05, 3.23, 3.55, 3.6, 5 and 9, respectively. It is also relevant to notice that when kZt is equal 5 and 9, almost all, if not all, parameterizations for which the existence of the autocorrelations is ensured, verify ⇢1 (1) > ⇢1 (2). These representations were obtained for other centered and reduced distribu- tions, namely, triangular (kZt =2.4), Gaussian (kZt =3) and Laplace (kZt =6), displaying the same behaviour.
4. The Taylor effect in the -TGARCH(1,1) model
In this section, we consider the first-order -TGARCH model with not necessarily equal to 1. Since both theoretical expressions of ⇢1 (1) and ⇢1 (2) are only available for = 1, the Taylor e↵ect is analysed here via simulation.
Taking into account the final remarks of the previous section, we considered two zero mean and unit variance distributions for the generating process mar- gins, namely the Gaussian and Laplace. For these distributions and in order to compare the ability that models with di↵erent values of have to gener- ate series with the Taylor e↵ect, we considered four values of , specifically 0.25, 0.5, 1 and 2, and three parameterizations for each one of them. In order to guarantee the existence of the autocorrelations, all parameterizations satisfy # ,4/ < 1, with 4/ an integer. These eight sets of three parameterizations have
(n 2)⇡ n n 2 2
