
Page 55 - Textos de Matemática Vol. 47
P. 55
Figure
⇢1 (2)
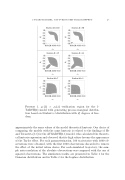
verification region for the
1-
-TGARCH MODEL: CAPTURING THE TAYLOR EFFECT
45
Student df 120 1.0
0.8 0.6 0.4 0.2 0.0
0.00.20.40.60.81.0
Α1
Student df 15 1.0
0.8 0.6 0.4 0.2 0.0
0.00.20.40.60.81.0
Α1
Student df 7 1.0
0.8 0.6 0.4 0.2 0.0
0.00.20.40.60.81.0 Α1
Student df 30 1.0
0.8 0.6 0.4 0.2 0.0
0.00.20.40.60.81.0
Α1
Student df 14 1.0
0.8 0.6 0.4 0.2 0.0
0.00.20.40.60.81.0
Α1
Student df 5 1.0
0.8 0.6 0.4 0.2 0.0
0.00.20.40.60.81.0 Α1
Β1 Β1 Β1
Β1 Β1 Β1
1. ⇢1 (1) >
TARCH(1) model with generating process marginal distribu- tion based on Student’s t-distribution with df degrees of free- dom.
approximately the same values of the model theoretical kurtosis. Our choice of comparing the models with the same kurtosis is related to the findings of He and Ter¨asvirta [13] for the AVGARCH(1,1) model, who calculated the theoreti- cal kurtosis expression and observed that its high values favours the appearance of the Taylor e↵ect. For each parameterization, 100 trajectories with 4000 ob- servations were obtained, with the first 1000 observations discarded to remove the e↵ect of the initial values choice. For each simulated trajectory, the sam- ple autocorrelation of the absolute observations was compared with the one of squared observations. The simulation results are presented in Table 1 for the Gaussian distribution and in Table 2 for the Laplace distribution.
